Category: Trading Education

  • Understanding the Stock Market: A Beginner-Friendly Guide

    PK MARKET LABS • BEGINNER EDUCATION

    Understanding the Stock Market

    A complete beginner-friendly guide to shares, stock exchanges, indices, investing, trading, analysis, risk management, derivatives, commodities, psychology and the practical steps required to build market knowledge safely.

    Absolute Beginner Friendly
    Indian Market Context
    Step-by-Step Learning
    Stocks • Indices • F&O • MCX
    Risk-Aware Approach

    1. What Is the Stock Market?

    The stock market is a regulated system where shares of publicly listed companies are bought and sold. When you purchase a share, you are buying a small ownership interest in that company.

    For a complete beginner, the easiest way to understand the stock market is to imagine a large electronic marketplace. Instead of buying vegetables, clothes or electronics, participants buy and sell ownership units of companies.

    Suppose a company has divided its ownership into 10 crore shares. If you own 100 shares, your ownership percentage is very small, but you are still legally a shareholder of that company.

    Simple definition: A stock market connects companies that need capital with investors who want to participate in the growth of those companies.

    The market also allows existing investors to sell their shares to other investors. This continuous buying and selling creates liquidity and enables price discovery.

    2. Why Do Stock Markets Exist?

    Companies need money to grow. They may need capital to build factories, open new offices, develop products, acquire competitors, invest in technology or expand into new markets.

    One way to raise money is through debt. Another way is to raise equity capital by issuing shares to investors.

    For Companies

    The stock market can help companies raise capital, build visibility, expand their shareholder base and create a transparent market value for the business.

    For Investors

    Investors gain the opportunity to participate in business growth, receive dividends when declared, and potentially benefit from long-term price appreciation.

    Stock markets therefore play an important economic role. They help move savings from individuals and institutions into productive businesses.

    3. What Does Owning a Share Really Mean?

    A share is a unit of ownership in a company. If you buy shares of a listed company, you become one of its shareholders.

    Depending on the company and the type of shares, shareholders may receive certain rights and economic benefits.

    • Potential capital appreciation if the share price rises
    • Dividends if the company declares them
    • Voting rights in certain corporate matters
    • Participation in bonus issues, rights issues and other corporate actions

    However, share ownership also involves risk. If the company performs poorly, loses market share, becomes highly indebted or faces regulatory problems, its share price may decline significantly.

    Important: Owning a share means owning part of a business. A stock ticker is not just a moving number on a chart.

    4. Primary Market and Secondary Market

    Primary Market

    This is where securities are issued to investors for the first time. An Initial Public Offering, commonly called an IPO, is one example.

    In the primary market, capital generally flows to the company issuing the shares.

    Secondary Market

    This is where already-listed shares are traded between investors on stock exchanges such as NSE and BSE.

    Most daily stock-market activity that traders see on charts happens in the secondary market.

    After listing, the market continuously determines the price of a share based on supply, demand, expectations and information.

    5. NSE, BSE and SEBI

    India has a well-developed market infrastructure. Three names every beginner should understand are NSE, BSE and SEBI.

    Institution Simple Meaning
    NSE National Stock Exchange of India, one of the country’s major electronic exchanges.
    BSE BSE Limited, one of Asia’s oldest stock exchanges.
    SEBI Securities and Exchange Board of India, the regulator responsible for protecting investors and regulating securities markets.

    Exchanges provide the trading platform and market infrastructure. SEBI creates and enforces rules intended to promote orderly, transparent and fair markets.

    6. Demat Account, Trading Account and Broker

    To buy listed shares in India, an investor generally needs access through a registered broker.

    Demat Account

    A Demat account stores securities electronically. It replaces the old system of physical share certificates.

    Trading Account

    A trading account is used to place buy and sell orders in the market.

    Broker

    A broker provides the platform through which an investor connects to the exchange. Brokers may offer web platforms, mobile applications, APIs, research tools and other services.

    Beginner rule: Before opening any account, understand brokerage, exchange charges, taxes, platform fees, margin rules and the services actually included.

    7. How Does a Stock Trade Actually Happen?

    Modern stock markets operate electronically. A typical trade passes through several stages.

    1You place an order through your broker.
    2The order is transmitted to the exchange.
    3The exchange matches compatible buy and sell orders.
    4The trade is executed at the matched price.
    5Clearing and settlement complete the transaction.

    Market Order

    A market order seeks execution at the best available price. The exact price is not guaranteed, especially in fast or illiquid markets.

    Limit Order

    A limit order specifies the maximum price a buyer is willing to pay or the minimum price a seller is willing to accept. Execution is not guaranteed.

    Understanding order types is essential because poor execution can increase trading costs and risk.

    8. Nifty, Sensex and Stock-Market Indices

    An index is a basket of selected securities used to represent a particular segment of the market.

    Nifty 50

    A major NSE index representing 50 large listed companies across different sectors.

    Sensex

    A major BSE index tracking 30 large and established companies.

    Sector Indices

    Indices such as banking, IT, auto, pharma and metals help track individual industries.

    Indices are important because they help investors understand whether market movement is broad-based or concentrated in only a few stocks.

    9. Who Participates in the Stock Market?

    Retail Investors

    Individuals investing or trading their own capital.

    Mutual Funds

    Professional fund managers investing pooled investor money according to a defined mandate.

    Insurance & Pension Funds

    Large institutions that may invest with long-term objectives.

    Foreign Portfolio Investors

    Foreign entities participating in Indian securities markets under applicable regulations.

    Proprietary Traders

    Professional trading desks using institutional capital.

    Short-Term Traders

    Participants focusing on intraday, swing or positional price movement.

    Because many different participants operate simultaneously, the market reflects a wide variety of time horizons, objectives and strategies.

    10. Why Do Share Prices Move?

    Share prices move because expectations change. Buyers and sellers continuously reassess what a company may be worth in the future.

    Important drivers include:

    • Quarterly earnings and annual results
    • Revenue growth and profit margins
    • Management guidance
    • Debt levels and cash flow
    • Interest rates and inflation
    • Government policy and regulation
    • Global markets
    • Currency movement
    • Commodity prices
    • Institutional flows
    • Market sentiment and liquidity

    Short-term prices can be volatile even when the long-term business story has not changed significantly.

    11. Dividends, Bonus Shares, Stock Splits and Rights Issues

    Dividend

    A dividend is a distribution a company may make to shareholders from profits or accumulated reserves. Dividends are not guaranteed.

    Bonus Issue

    A bonus issue provides additional shares to existing shareholders in a specified ratio.

    Stock Split

    A stock split reduces the face value per share and increases the number of shares proportionately. It does not create wealth by itself.

    Rights Issue

    A rights issue gives eligible existing shareholders an opportunity to purchase additional shares, usually according to defined terms.

    Beginners should understand that corporate actions may change share count, market price and accounting presentation without automatically changing the underlying value of the business.

    12. Large-Cap, Mid-Cap and Small-Cap Stocks

    Companies are often grouped according to market capitalization.

    Category General Characteristics
    Large Cap Large established businesses, often with greater liquidity and institutional participation.
    Mid Cap Medium-sized companies that may offer growth potential with higher volatility.
    Small Cap Smaller listed companies that may have higher growth potential but can also carry significantly higher risk and volatility.

    Market capitalization alone does not determine whether a stock is good or bad. Business quality, valuation, management and risk still matter.

    13. Investing and Trading Are Different Activities

    Aspect Investing Trading
    Main Objective Participate in long-term business growth Capture shorter-term market movement
    Typical Holding Period Months to years Minutes to weeks
    Main Analysis Business quality, earnings, valuation Price action, trend, volume, momentum
    Activity Level Usually lower Usually higher
    Risk Approach Diversification, allocation, valuation discipline Position sizing, invalidation, trade selection

    Neither approach is automatically superior. The right approach depends on objectives, capital, time horizon, knowledge, temperament and risk tolerance.

    14. What Is Fundamental Analysis?

    Fundamental analysis studies the business behind the stock. Its purpose is to understand the quality, financial strength and potential value of a company.

    Common areas of study include:

    • Revenue growth
    • Profit growth
    • Operating margins
    • Debt
    • Cash flow
    • Return on Equity
    • Return on Capital Employed
    • Promoter holding
    • Industry position
    • Management quality
    • Valuation ratios such as P/E and P/B

    A strong company can still be a poor investment if bought at an unreasonable valuation. Likewise, a low-priced stock is not automatically cheap.

    15. What Is Technical Analysis?

    Technical analysis studies price, volume and market behaviour using charts.

    Common concepts include:

    Trend

    Whether price is generally moving upward, downward or sideways.

    Support & Resistance

    Areas where buying or selling activity may become important.

    Volume

    Helps evaluate participation behind a price move.

    Moving Averages

    Tools such as EMA can help visualize direction and trend structure.

    RSI & Momentum

    Momentum indicators can help evaluate the strength of price movement.

    Market Structure

    Higher Highs, Higher Lows, Lower Highs and Lower Lows help describe trend behaviour.

    Technical analysis should not be treated as a prediction machine. It is a framework for organizing price information and managing probabilities.

    16. Intraday, Swing and Positional Trading

    Intraday Trading

    Positions are opened and closed within the same trading session. Intraday trading is fast, demanding and highly sensitive to execution and risk management.

    Swing Trading

    Positions may be held for several days or weeks to capture intermediate market moves.

    Positional Trading

    Positions may be held for a longer period based on broader technical or fundamental views.

    Beginner caution: Active trading should be approached only after understanding order types, volatility, risk, brokerage, taxes and position sizing.

    17. Futures and Options Basics

    Futures and Options are derivative instruments. Their value is linked to an underlying asset such as a stock, index or commodity.

    Futures

    A futures contract creates an obligation to buy or sell the underlying exposure according to contract terms. Futures involve leverage.

    Options

    Options provide rights linked to an underlying asset. Calls and Puts behave differently, and option value is influenced by several variables.

    Important option concepts include:

    • Strike price
    • Expiry
    • Premium
    • Intrinsic value
    • Time value
    • Implied Volatility
    • Delta
    • Gamma
    • Theta
    • Vega

    Derivatives are powerful tools but can produce rapid losses if used without proper knowledge.

    18. Understanding the MCX Commodity Market

    The Indian market is not limited to stocks. The Multi Commodity Exchange, commonly known as MCX, provides trading in commodity derivatives.

    Major commodity segments include:

    • Gold
    • Silver
    • Crude Oil
    • Natural Gas
    • Copper
    • Aluminium
    • Zinc
    • Lead

    Commodity prices are influenced by global supply and demand, currency movement, geopolitical developments, weather, inventory reports and international markets.

    MCX contracts also have specific lot sizes, expiry rules and margin requirements. Beginners should understand contract specifications before participating.

    19. Risk Management: The Foundation of Survival

    Risk management is more important than finding a perfect indicator or strategy.

    Good risk habits include:

    • Never risk money required for essential expenses
    • Avoid oversized exposure in one stock or trade
    • Use sensible position sizing
    • Understand leverage before using it
    • Define a maximum acceptable loss
    • Avoid revenge trading
    • Review trading costs and slippage
    • Keep written records of decisions

    Professional market participation begins with the question: What happens if I am wrong?

    20. Trading Psychology and Discipline

    Markets are not only about charts and numbers. Human behaviour plays a major role.

    Common psychological challenges include:

    • Fear of missing out
    • Greed
    • Overconfidence
    • Revenge trading
    • Impatience
    • Changing strategies too frequently
    • Refusing to accept a loss

    A disciplined participant uses rules, journals, risk limits and realistic expectations to reduce emotional decision-making.

    21. A Practical Beginner Learning Roadmap

    1

    Learn Market Basics

    Shares, exchanges, indices, Demat accounts, brokers, order types and settlement.

    2

    Understand Risk

    Capital allocation, position size, diversification and the dangers of leverage.

    3

    Learn Fundamental Analysis

    Understand financial statements, profitability, debt and valuation.

    4

    Learn Technical Analysis

    Study trends, support, resistance, volume, RSI, EMA and market structure.

    5

    Practice

    Use charts, paper trading and historical examples before taking meaningful risk.

    6

    Build a Process

    Create a repeatable checklist and keep a journal.

    7

    Study Derivatives Later

    Learn Futures and Options only after mastering the underlying market.

    8

    Review Continuously

    Markets evolve. Keep learning and improving your process.

    9

    Protect Capital

    Survival and consistency are more important than one big trade.

    22. Common Beginner Mistakes

    1. Following tips blindly: never act only because someone claims a stock will rise.
    2. Expecting quick money: the stock market is not a guaranteed income machine.
    3. Using leverage too early: leverage can multiply losses rapidly.
    4. Overtrading: more trades do not automatically mean more profit.
    5. Ignoring costs: brokerage, taxes and slippage matter.
    6. No risk plan: every position should have a defined risk framework.
    7. Buying only because price has fallen: lower price does not always mean better value.
    8. Selling only because price has risen: strong businesses can remain strong for long periods.
    9. Changing strategy after every loss: a method cannot be evaluated without a proper sample.
    10. Ignoring education: market knowledge must come before aggressive participation.

    23. How AI Can Help You Learn the Stock Market

    Artificial Intelligence can be useful as a learning and research assistant when used carefully.

    AI can help with:

    • Explaining complex financial terms in simple language
    • Creating study checklists
    • Summarizing annual reports
    • Comparing financial ratios
    • Generating questions for self-study
    • Organizing trading journals
    • Explaining indicators and formulas
    • Creating scenario-based learning exercises
    Important: AI output should be verified. It should not be treated as guaranteed market advice or a substitute for official data and professional judgment.

    24. Beginner Stock-Market Glossary

    Term Meaning
    Share A unit of ownership in a company.
    Equity Ownership interest in a business.
    Demat Account An account used to hold securities electronically.
    Broker A registered intermediary that provides market access.
    Market Capitalization Market value of a company’s outstanding shares.
    Volume Number of shares or contracts traded during a period.
    Liquidity How easily an asset can be traded without large price impact.
    Volatility The speed and magnitude of price movement.
    Dividend A distribution a company may make to shareholders.
    IPO Initial Public Offering.
    Bull Market A market environment generally associated with rising prices.
    Bear Market A market environment generally associated with falling prices.
    Support A price area where buying interest may emerge.
    Resistance A price area where selling interest may emerge.
    Stop Loss A predefined mechanism used to limit loss according to a trading plan.

    25. Frequently Asked Questions

    Can an absolute beginner learn the stock market?

    Yes. Begin with basic concepts, then progress gradually to analysis, risk management and more advanced instruments.

    How much money is required to start?

    There is no single correct amount. The important point is that the capital should be genuinely surplus and appropriate for your risk capacity.

    Is stock-market investing guaranteed to make money?

    No. Prices can rise or fall and losses are possible.

    Is intraday trading suitable for beginners?

    Intraday trading is fast and risky. Beginners should first learn market mechanics, order execution and risk management.

    Should beginners start with Futures and Options?

    Usually it is better to understand the underlying cash market thoroughly before moving to leveraged derivatives.

    Which is better: fundamental analysis or technical analysis?

    They serve different purposes. Investors often focus more on fundamentals, while active traders may rely more heavily on technical analysis. Many participants use both.

    Can AI predict the stock market?

    No AI system can reliably guarantee future prices. AI is better used as a research, organization and learning assistant.

    Final Thoughts

    The stock market can be a powerful place to learn about businesses, economics, investing and human behaviour. But it should never be approached as a shortcut to guaranteed wealth.

    A strong foundation begins with simple concepts: understand what a share is, how exchanges work, why prices move, how to analyze a business, how charts work and how risk should be controlled.

    After that foundation is built, a learner can gradually explore advanced topics such as swing trading, intraday strategies, Futures, Options, indices, MCX commodities, psychology and AI-assisted research.

    The most important principle is simple:
    Learn first. Practice second. Risk capital only after you understand the process.

    Educational & Risk Disclaimer

    This article is published by PK Market Labs for educational and informational purposes only.

    It does not constitute investment advice, trading advice, research recommendation, portfolio advice, or an offer or solicitation to buy or sell securities, derivatives, commodities or any other financial instrument.

    Investing and trading involve financial risk, including possible loss of capital. Readers should conduct their own research, understand product and market risks, and consult an appropriately qualified or SEBI-registered professional where required before making financial decisions.

    No strategy, indicator, scanner, dashboard, chart pattern or AI tool can guarantee profits or eliminate losses.

    PK Market Labs • Learn | Analyze | Grow

  • PDH & PDL Trading Strategy: Complete Intraday Guide

    PDH & PDL Trading Strategy: Complete Intraday Guide

    PK MARKET LABS • TRADING EDUCATION

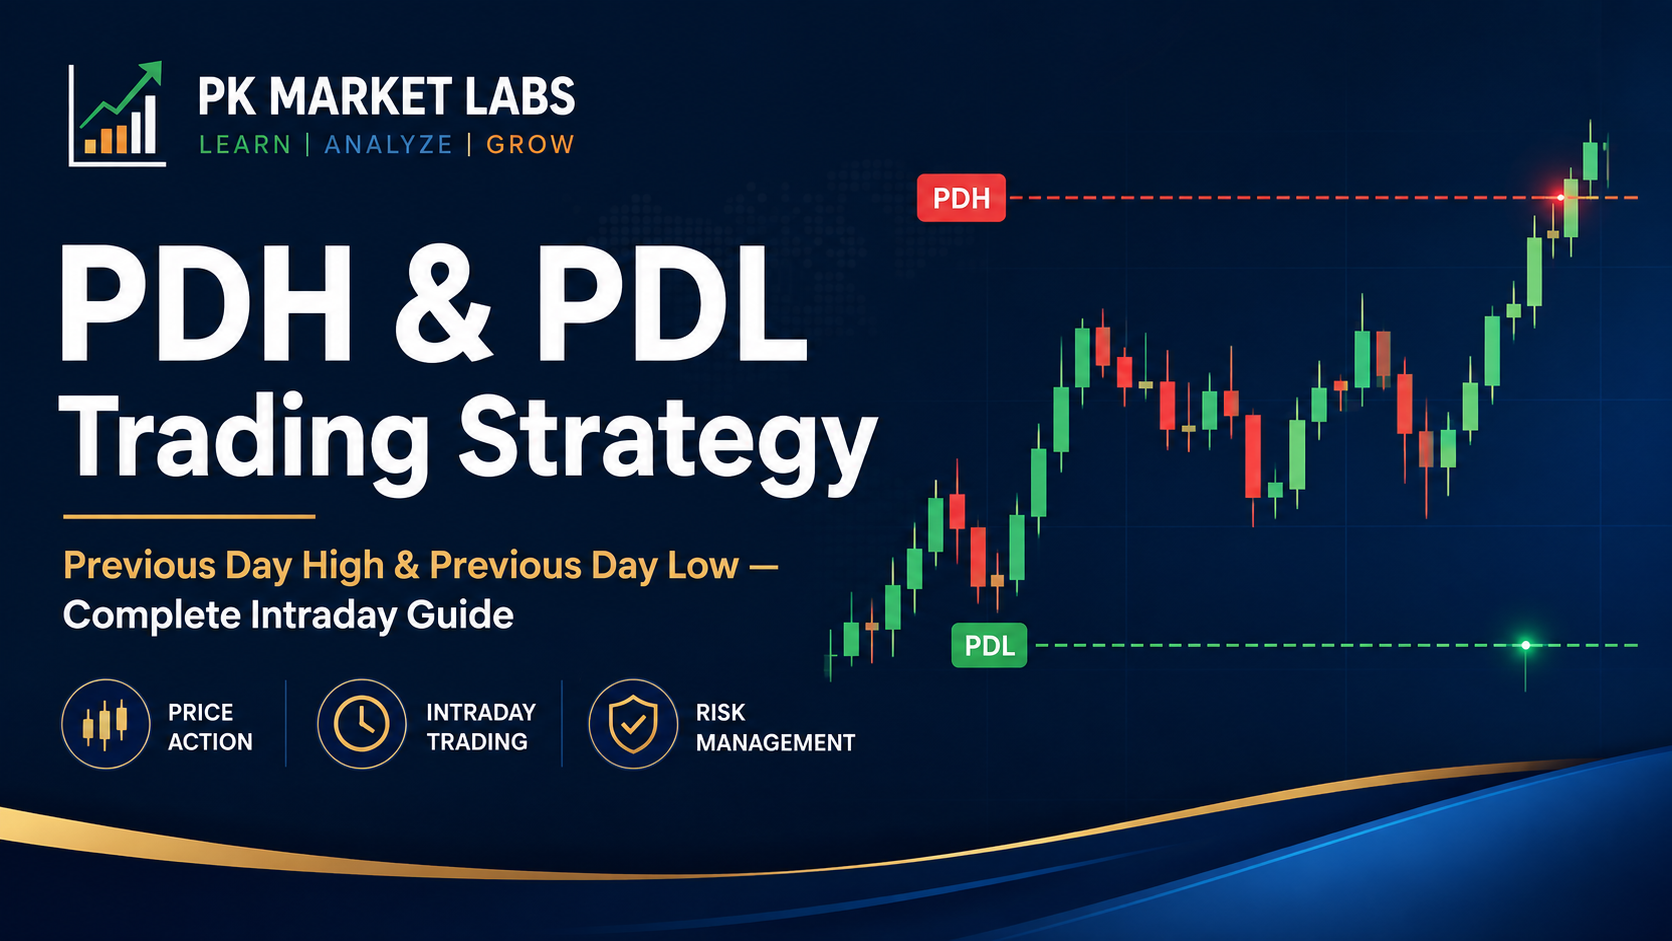
    PDH & PDL Trading Strategy: Complete Intraday Guide to Previous Day High and Low

    Previous Day High (PDH) and Previous Day Low (PDL) are two of the simplest price levels on an intraday chart, yet they can reveal important information about support, resistance, liquidity, breakouts, failed breakouts, trend continuation and market structure.

    Beginner FriendlyPrice ActionIntraday TradingRisk Management

    Core idea: PDH and PDL are not automatic Buy or Sell signals. They are reference levels. A trader should study how price approaches, breaks, rejects, retests or reclaims these levels.

    What Is PDH?

    PDH means Previous Day High. It is the highest price traded during the previous trading session.

    Previous Open₹1,470
    Previous High₹1,520
    Previous Low₹1,455
    Previous Close₹1,505

    In this example, the PDH for the current session is ₹1,520. Traders may watch that level because it marks the highest price accepted during the previous session.

    What Is PDL?

    PDL means Previous Day Low. It is the lowest price traded during the previous trading session. In the same example, PDL is ₹1,455.

    PDL can become an important reference when price approaches the lower boundary of the previous day’s range. It may behave as support, but it is not guaranteed to hold.

    Why Are Previous Day High and Low Important?

    Financial markets repeatedly react around prices that were important earlier. PDH and PDL are especially visible because every trader using a normal chart can identify them. As a result, these areas can attract many types of orders.

    Support & Resistance

    PDH can behave like resistance when approached from below, while PDL can behave like support when approached from above.

    Breakout Areas

    When price moves beyond the entire previous day’s range, traders may study whether genuine range expansion is developing.

    Liquidity Zones

    Visible highs and lows often attract breakout orders, stop orders and algorithmic activity, which can increase volatility around the level.

    The important point is that the line itself does not predict the future. The information comes from how the market behaves around the line.

    The Simple Three-Zone PDH/PDL Market Map

    ABOVE PDHPrice is trading above yesterday’s entire range. This may indicate relative strength if the move is accepted.
    BETWEEN PDH & PDLPrice remains inside yesterday’s range. The market may be balanced, consolidating or waiting for expansion.
    BELOW PDLPrice is trading below yesterday’s entire range. This may indicate weakness if sellers maintain control.

    This simple framework immediately tells the trader where the current session stands in relation to the previous day’s range.

    Understanding a PDH Breakout

    Suppose yesterday’s high was ₹1,000. During the current session price gradually rises toward the level and trades at ₹1,002. A beginner may immediately think that PDH has broken and the market must continue higher. That conclusion is incomplete.

    Stronger-Looking Breakout

    • Price approaches PDH with constructive structure.
    • A candle closes clearly above the level.
    • Volume expands.
    • Price is above VWAP.
    • The sector and broader market are supportive.
    • Price remains above PDH after the break.

    Weaker-Looking Breakout

    • Price barely trades above PDH.
    • Volume remains weak.
    • A large upper wick develops.
    • Price immediately falls back below PDH.
    • The broader market is weak.
    • There is no follow-through.
    Remember: a PDH crossing and a confirmed PDH breakout are not necessarily the same thing.

    Understanding a PDL Breakdown

    The same logic works in reverse. Suppose yesterday’s low was ₹800 and price trades briefly at ₹797. That single tick below PDL does not automatically mean sustained bearish movement.

    A stronger bearish context may involve a firm close below PDL, expanding selling volume, price below VWAP, Lower High/Lower Low structure and weakness in the relevant sector or index.

    A weak breakdown may show a long lower wick, immediate recovery above PDL and strong buying participation. In that situation, the breakdown may have failed.

    Breakout and Retest: One of the Most Useful PDH/PDL Concepts

    Many traders prefer to study what happens after a breakout rather than reacting to the first crossing.

    1Price approaches PDH
    2Price breaks and closes above
    3Price pulls back toward PDH
    4Old resistance is tested as support
    5Buyers defend the area
    6Price attempts continuation

    For a bearish setup, the sequence is reversed: PDL breaks, price rebounds toward the old support, sellers reject the recovery, and the level may begin acting as resistance.

    Market principle: old resistance can become support, and old support can become resistance.

    False Breakouts, Failed Breakdowns and Liquidity Sweeps

    Previous-day highs and lows are obvious levels. Because they are obvious, they can attract clusters of orders. These may include breakout entries, stop losses, profit-taking orders and algorithmic instructions.

    Sometimes price moves slightly above PDH, triggers orders and then rapidly reverses below the level. The opposite can happen under PDL. This behaviour is often described as a false breakout, failed breakdown or liquidity sweep, depending on the methodology being used.

    False PDH Breakout

    Price trades above the previous high but cannot sustain the move. A quick return below PDH can trap late breakout buyers.

    False PDL Breakdown

    Price briefly moves below the previous low but quickly reclaims it. Aggressive sellers may become trapped if buying pressure strengthens.

    A false break does not automatically guarantee a reversal either. Traders should still wait for subsequent price structure and confirmation.

    PDH/PDL and Market Structure

    Market structure helps the trader understand whether the price action is generally progressing upward, downward or sideways.

    Bullish Structure

    A common bullish sequence is Higher High → Higher Low → Higher High → Higher Low. If PDH breaks while this structure is intact, the breakout is occurring with the prevailing direction.

    Bearish Structure

    A common bearish sequence is Lower High → Lower Low → Lower High → Lower Low. If PDL breaks while this structure is intact, the move is aligned with existing weakness.

    A PDH breakout against a strongly bearish structure is very different from a PDH breakout after several Higher High/Higher Low sequences. Context matters.

    Useful Confirmations: VWAP, EMA, Volume, RSI and ADX

    1. VWAP

    VWAP, or Volume Weighted Average Price, is a widely used intraday reference. A PDH breakout occurring while price is consistently above a rising VWAP may have better bullish context. A PDL breakdown while price remains below VWAP can provide bearish context.

    2. EMA Trend

    Short-term moving averages such as the 9 EMA, 20 EMA or 21 EMA can help visualize directional bias. A breakout that aligns with an existing bullish EMA structure is different from one that occurs against a clearly falling trend.

    3. Volume

    Volume can help evaluate participation. A strong candle closing beyond PDH or PDL with noticeably expanding volume may carry more information than a low-volume move that immediately reverses.

    4. RSI

    RSI can provide momentum context. However, an elevated RSI does not automatically mean the market must fall, and a low RSI does not automatically mean it must rise. Momentum indicators should be interpreted with price behaviour.

    5. ADX

    ADX is primarily a trend-strength indicator. A very low ADX environment may indicate weak directional movement, while a rising ADX may signal that trend strength is increasing. ADX does not itself indicate bullish or bearish direction.

    Factor Possible Bullish PDH Context Possible Bearish PDL Context
    VWAP Price above VWAP Price below VWAP
    Structure Higher High / Higher Low Lower High / Lower Low
    Volume Expands on breakout Expands on breakdown
    EMA Short-term alignment supportive Short-term alignment bearish
    Retest PDH holds as support PDL rejects as resistance

    Opening Gaps and the First 15 Minutes

    Gap Above PDH

    If today’s market opens directly above PDH, there was no conventional intraday breakout through the previous high. Instead, traders may study whether price can hold above PDH or whether the opening gap begins to fail.

    Gap Below PDL

    If price opens below PDL, the previous low may become resistance during any recovery. The key question becomes whether the market can reclaim the level.

    Why the First 15 Minutes Can Be Different

    The opening phase often contains elevated volatility because overnight information, institutional orders, gaps and early stop orders are being processed. Some traders deliberately wait for initial structure before judging a PDH/PDL move.

    Caution: the best opening rule is not universal. It should come from testing your own strategy across many sessions.

    Broader Market and Sector Confirmation

    Individual stocks do not trade in isolation. For NSE stocks, traders may also study Nifty 50, Bank Nifty, the relevant sector index and market breadth.

    For example, a banking stock breaking PDH while Bank Nifty and several major banking constituents are also strong has different context from an isolated breakout while the banking sector is falling sharply.

    Index Direction

    Check whether Nifty or Bank Nifty supports or contradicts the stock’s movement.

    Sector Direction

    Bank, IT, Auto, Pharma, Metal and other sector indices can help show whether participation is broad.

    Market Breadth

    Advance/decline participation can reveal whether an index move is broad-based or being driven by only a few heavyweights.

    PDH/PDL for F&O Stocks and Open Interest Context

    For derivatives, PDH/PDL can be combined with futures price, volume, Open Interest and change in Open Interest. Traders often use broad classifications such as Long Buildup, Short Buildup, Short Covering and Long Unwinding.

    Price Open Interest Common Analytical Description
    Up Up Long Buildup
    Down Up Short Buildup
    Up Down Short Covering
    Down Down Long Unwinding

    These are descriptive interpretations, not guaranteed trading signals. They should be combined with price action, liquidity, trend and risk management.

    Options Require Additional Care

    Option prices are influenced by the underlying price as well as implied volatility, time decay, Delta, Gamma, Vega, strike selection and days to expiry. A PDH breakout in an index does not mean every option contract will respond in the same way.

    PDH/PDL in MCX Markets

    The same previous-day high/low framework can also be studied in liquid commodity markets such as Gold, Silver, Crude Oil, Natural Gas and Copper. Commodity traders should additionally consider global influences.

    Gold

    May react to the US Dollar, Treasury yields, central-bank expectations and global risk sentiment.

    Crude Oil

    May react to global demand, inventory data, OPEC-related developments and geopolitical events.

    Technical levels remain useful, but they should be interpreted within the broader market environment.

    Risk Management Is More Important Than the Setup

    No technical setup wins every time. Even an apparently perfect PDH breakout can fail. A professional framework therefore defines risk before taking exposure.

    A disciplined trader defines:

    • Maximum acceptable risk per trade
    • Position size
    • Invalidation condition
    • Maximum daily loss
    • Maximum number of trades
    • Conditions under which no trade should be taken

    Position Sizing

    Position size should be based on predefined risk, not excitement. A setup that looks attractive is still uncertain. Oversized exposure can turn one ordinary failed breakout into a disproportionately large loss.

    Stop-Loss / Invalidation Logic

    The invalidation point should relate to the logic of the setup, such as a failed retest, a recent swing point or a structural breakdown. There is no single stop rule suitable for every instrument and timeframe.

    Risk-to-Reward Ratio

    Ratios such as 1:1.5, 1:2 or 1:3 can be useful, but they do not determine profitability by themselves. Overall performance depends on win rate, average winner, average loser, brokerage, taxes, slippage, execution and discipline.

    Trading psychology: revenge trading, FOMO, repeated re-entry and increasing position size after a loss can destroy even a well-tested strategy.

    Backtesting, Forward Testing and Trading Journals

    A PDH/PDL strategy should be studied over a meaningful sample instead of judged from a handful of attractive charts.

    What to Record

    Field Example
    Date Trading session
    Instrument Nifty, Bank Nifty, stock or commodity
    PDH / PDL Exact previous-day levels
    Opening Condition Inside range, gap above PDH, gap below PDL
    Break Time When the level was crossed
    VWAP / Structure Above/below VWAP, HH-HL or LH-LL
    Volume Strong, normal or weak
    Retest Yes / No
    Outcome Continuation, failure, reversal, no follow-through
    Lesson What should be repeated or avoided

    After 50, 100 or 200 observations, patterns may become clearer. You may discover that certain times, sectors, gap conditions or volume profiles behave differently.

    Professional PDH/PDL Observation Checklist

    ✓ Is the instrument sufficiently liquid?
    ✓ Is price above, below or inside yesterday’s range?
    ✓ What is the broader market direction?
    ✓ What is the relevant sector direction?
    ✓ Is market structure bullish, bearish or mixed?
    ✓ Where is price relative to VWAP?
    ✓ Is volume expanding near the level?
    ✓ Did the candle close beyond PDH or PDL?
    ✓ Was the move a clean breakout or only a brief sweep?
    ✓ Did a retest occur, and did it hold?
    ✓ Is major support or resistance very close?
    ✓ Is there scheduled event risk?
    ✓ Is risk clearly defined before the trade?
    Do not trade the line alone. Study the behaviour around the line.

    Common Beginner Mistakes

    1. Buying immediately above PDH: a brief move above the level can fail.
    2. Selling immediately below PDL: price can sweep the low and recover quickly.
    3. Ignoring volume: weak participation may reduce confidence in a breakout.
    4. Ignoring market direction: a stock breakout against a strongly weak market deserves additional caution.
    5. Trading every touch: most PDH/PDL interactions are not automatically high-quality setups.
    6. Chasing very large candles: the move may already be extended.
    7. Oversizing: no setup is guaranteed.
    8. Skipping backtesting: attractive chart examples are not proof of a repeatable edge.

    Can PDH/PDL Be Automated in a Scanner or Dashboard?

    Yes. A scanner or dashboard can automatically calculate and display:

    Level Status

    PDH, PDL, distance from the level, breakout, breakdown and retest state.

    Confirmation Data

    VWAP, EMA alignment, RSI, ADX, volume and market structure.

    Context

    Sector trend, market breadth, F&O Open Interest and multi-timeframe direction.

    Automation can save time and organize information, but it does not eliminate market risk or the need for proper testing and human judgment.

    Frequently Asked Questions

    What does PDH mean in trading?

    PDH stands for Previous Day High, the highest traded price of the previous trading session.

    What does PDL mean in trading?

    PDL stands for Previous Day Low, the lowest traded price of the previous trading session.

    Is PDH always resistance?

    No. PDH may act as resistance when approached from below, but after a successful breakout it may sometimes act as support.

    Is PDL always support?

    No. PDL may act as support when approached from above, but after a successful breakdown it may sometimes act as resistance.

    Does crossing PDH automatically mean the market will rise?

    No. Price can cross PDH temporarily and then reverse. Candle close, volume, structure and follow-through matter.

    Does crossing PDL automatically mean the market will fall?

    No. False breakdowns and liquidity sweeps can occur. Confirmation is important.

    Which timeframe is best for PDH/PDL?

    There is no universally best timeframe. Many intraday traders study 5-minute or 15-minute charts while using higher timeframes for broader context.

    Can PDH/PDL be used for Nifty and Bank Nifty?

    Yes. The concept can be applied to indices as well as liquid stocks, futures and other markets.

    Can PDH/PDL be combined with VWAP?

    Yes. VWAP can provide additional intraday context, but it should not be treated as a guarantee.

    Does a PDH/PDL strategy guarantee profits?

    No. No technical-analysis strategy can guarantee profits or prevent losses.

    Final Thoughts

    PDH and PDL are valuable because they are simple, transparent and based directly on price. A beginner can understand them quickly, while an experienced trader can combine them with market structure, VWAP, volume, trend, sector strength, derivatives data and multi-timeframe analysis.

    The central lesson is simple: do not treat Previous Day High as an automatic Buy level or Previous Day Low as an automatic Sell level. Study how price approaches, breaks, retests, rejects and reclaims these areas.

    A disciplined trader observes evidence, defines risk, keeps records and improves the framework through testing rather than prediction.

    Educational & Risk Disclaimer

    This article is published by PK Market Labs for educational and informational purposes only. It does not constitute investment advice, trading advice, research recommendation, portfolio advice, or an offer or solicitation to buy or sell any security, derivative, commodity or financial instrument.

    Trading and investing involve financial risk, including the possibility of capital loss. No technical indicator, chart pattern, scanner, dashboard or trading method can guarantee future performance, profits or protection from losses. Readers should conduct their own research, understand the risks involved and consult an appropriately qualified or SEBI-registered professional where required before making financial decisions.

    Published by PK Market Labs • pkmarketlabs.com