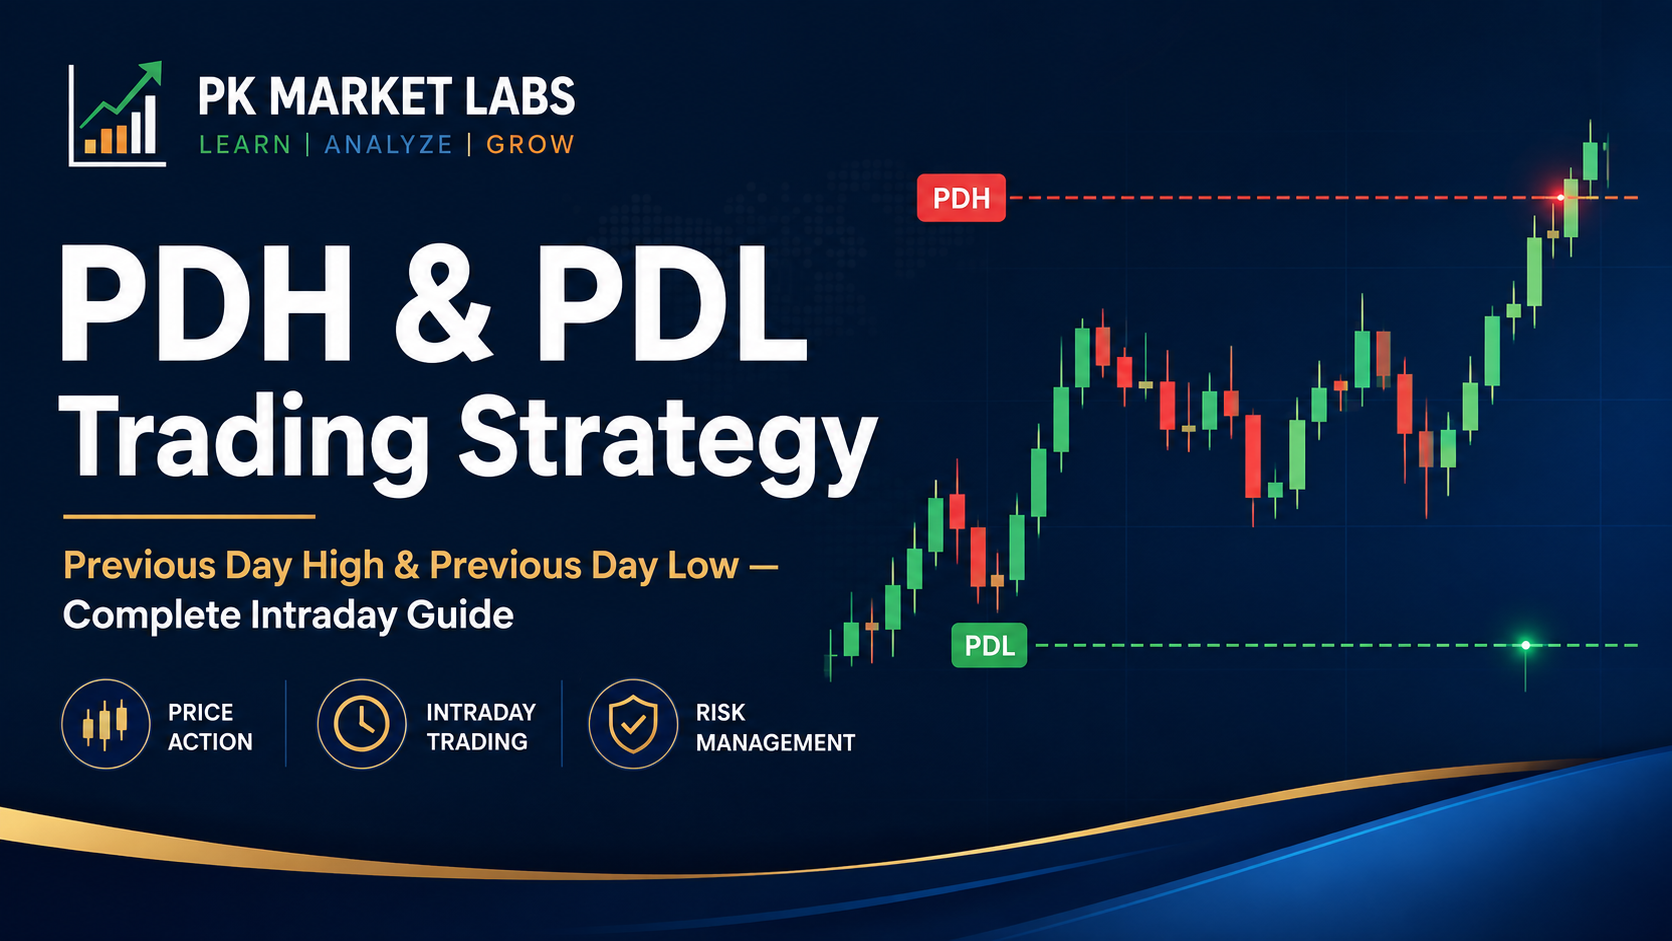
PDH & PDL Trading Strategy: Complete Intraday Guide to Previous Day High and Low
Previous Day High (PDH) and Previous Day Low (PDL) are two of the simplest price levels on an intraday chart, yet they can reveal important information about support, resistance, liquidity, breakouts, failed breakouts, trend continuation and market structure.
What Is PDH?
PDH means Previous Day High. It is the highest price traded during the previous trading session.
In this example, the PDH for the current session is ₹1,520. Traders may watch that level because it marks the highest price accepted during the previous session.
What Is PDL?
PDL means Previous Day Low. It is the lowest price traded during the previous trading session. In the same example, PDL is ₹1,455.
PDL can become an important reference when price approaches the lower boundary of the previous day’s range. It may behave as support, but it is not guaranteed to hold.
Why Are Previous Day High and Low Important?
Financial markets repeatedly react around prices that were important earlier. PDH and PDL are especially visible because every trader using a normal chart can identify them. As a result, these areas can attract many types of orders.
Support & Resistance
PDH can behave like resistance when approached from below, while PDL can behave like support when approached from above.
Breakout Areas
When price moves beyond the entire previous day’s range, traders may study whether genuine range expansion is developing.
Liquidity Zones
Visible highs and lows often attract breakout orders, stop orders and algorithmic activity, which can increase volatility around the level.
The important point is that the line itself does not predict the future. The information comes from how the market behaves around the line.
The Simple Three-Zone PDH/PDL Market Map
This simple framework immediately tells the trader where the current session stands in relation to the previous day’s range.
Understanding a PDH Breakout
Suppose yesterday’s high was ₹1,000. During the current session price gradually rises toward the level and trades at ₹1,002. A beginner may immediately think that PDH has broken and the market must continue higher. That conclusion is incomplete.
Stronger-Looking Breakout
- Price approaches PDH with constructive structure.
- A candle closes clearly above the level.
- Volume expands.
- Price is above VWAP.
- The sector and broader market are supportive.
- Price remains above PDH after the break.
Weaker-Looking Breakout
- Price barely trades above PDH.
- Volume remains weak.
- A large upper wick develops.
- Price immediately falls back below PDH.
- The broader market is weak.
- There is no follow-through.
Understanding a PDL Breakdown
The same logic works in reverse. Suppose yesterday’s low was ₹800 and price trades briefly at ₹797. That single tick below PDL does not automatically mean sustained bearish movement.
A stronger bearish context may involve a firm close below PDL, expanding selling volume, price below VWAP, Lower High/Lower Low structure and weakness in the relevant sector or index.
A weak breakdown may show a long lower wick, immediate recovery above PDL and strong buying participation. In that situation, the breakdown may have failed.
Breakout and Retest: One of the Most Useful PDH/PDL Concepts
Many traders prefer to study what happens after a breakout rather than reacting to the first crossing.
For a bearish setup, the sequence is reversed: PDL breaks, price rebounds toward the old support, sellers reject the recovery, and the level may begin acting as resistance.
False Breakouts, Failed Breakdowns and Liquidity Sweeps
Previous-day highs and lows are obvious levels. Because they are obvious, they can attract clusters of orders. These may include breakout entries, stop losses, profit-taking orders and algorithmic instructions.
Sometimes price moves slightly above PDH, triggers orders and then rapidly reverses below the level. The opposite can happen under PDL. This behaviour is often described as a false breakout, failed breakdown or liquidity sweep, depending on the methodology being used.
False PDH Breakout
Price trades above the previous high but cannot sustain the move. A quick return below PDH can trap late breakout buyers.
False PDL Breakdown
Price briefly moves below the previous low but quickly reclaims it. Aggressive sellers may become trapped if buying pressure strengthens.
A false break does not automatically guarantee a reversal either. Traders should still wait for subsequent price structure and confirmation.
PDH/PDL and Market Structure
Market structure helps the trader understand whether the price action is generally progressing upward, downward or sideways.
Bullish Structure
A common bullish sequence is Higher High → Higher Low → Higher High → Higher Low. If PDH breaks while this structure is intact, the breakout is occurring with the prevailing direction.
Bearish Structure
A common bearish sequence is Lower High → Lower Low → Lower High → Lower Low. If PDL breaks while this structure is intact, the move is aligned with existing weakness.
A PDH breakout against a strongly bearish structure is very different from a PDH breakout after several Higher High/Higher Low sequences. Context matters.
Useful Confirmations: VWAP, EMA, Volume, RSI and ADX
1. VWAP
VWAP, or Volume Weighted Average Price, is a widely used intraday reference. A PDH breakout occurring while price is consistently above a rising VWAP may have better bullish context. A PDL breakdown while price remains below VWAP can provide bearish context.
2. EMA Trend
Short-term moving averages such as the 9 EMA, 20 EMA or 21 EMA can help visualize directional bias. A breakout that aligns with an existing bullish EMA structure is different from one that occurs against a clearly falling trend.
3. Volume
Volume can help evaluate participation. A strong candle closing beyond PDH or PDL with noticeably expanding volume may carry more information than a low-volume move that immediately reverses.
4. RSI
RSI can provide momentum context. However, an elevated RSI does not automatically mean the market must fall, and a low RSI does not automatically mean it must rise. Momentum indicators should be interpreted with price behaviour.
5. ADX
ADX is primarily a trend-strength indicator. A very low ADX environment may indicate weak directional movement, while a rising ADX may signal that trend strength is increasing. ADX does not itself indicate bullish or bearish direction.
| Factor | Possible Bullish PDH Context | Possible Bearish PDL Context |
|---|---|---|
| VWAP | Price above VWAP | Price below VWAP |
| Structure | Higher High / Higher Low | Lower High / Lower Low |
| Volume | Expands on breakout | Expands on breakdown |
| EMA | Short-term alignment supportive | Short-term alignment bearish |
| Retest | PDH holds as support | PDL rejects as resistance |
Opening Gaps and the First 15 Minutes
Gap Above PDH
If today’s market opens directly above PDH, there was no conventional intraday breakout through the previous high. Instead, traders may study whether price can hold above PDH or whether the opening gap begins to fail.
Gap Below PDL
If price opens below PDL, the previous low may become resistance during any recovery. The key question becomes whether the market can reclaim the level.
Why the First 15 Minutes Can Be Different
The opening phase often contains elevated volatility because overnight information, institutional orders, gaps and early stop orders are being processed. Some traders deliberately wait for initial structure before judging a PDH/PDL move.
Broader Market and Sector Confirmation
Individual stocks do not trade in isolation. For NSE stocks, traders may also study Nifty 50, Bank Nifty, the relevant sector index and market breadth.
For example, a banking stock breaking PDH while Bank Nifty and several major banking constituents are also strong has different context from an isolated breakout while the banking sector is falling sharply.
Index Direction
Check whether Nifty or Bank Nifty supports or contradicts the stock’s movement.
Sector Direction
Bank, IT, Auto, Pharma, Metal and other sector indices can help show whether participation is broad.
Market Breadth
Advance/decline participation can reveal whether an index move is broad-based or being driven by only a few heavyweights.
PDH/PDL for F&O Stocks and Open Interest Context
For derivatives, PDH/PDL can be combined with futures price, volume, Open Interest and change in Open Interest. Traders often use broad classifications such as Long Buildup, Short Buildup, Short Covering and Long Unwinding.
| Price | Open Interest | Common Analytical Description |
|---|---|---|
| Up | Up | Long Buildup |
| Down | Up | Short Buildup |
| Up | Down | Short Covering |
| Down | Down | Long Unwinding |
These are descriptive interpretations, not guaranteed trading signals. They should be combined with price action, liquidity, trend and risk management.
Options Require Additional Care
Option prices are influenced by the underlying price as well as implied volatility, time decay, Delta, Gamma, Vega, strike selection and days to expiry. A PDH breakout in an index does not mean every option contract will respond in the same way.
PDH/PDL in MCX Markets
The same previous-day high/low framework can also be studied in liquid commodity markets such as Gold, Silver, Crude Oil, Natural Gas and Copper. Commodity traders should additionally consider global influences.
Gold
May react to the US Dollar, Treasury yields, central-bank expectations and global risk sentiment.
Crude Oil
May react to global demand, inventory data, OPEC-related developments and geopolitical events.
Technical levels remain useful, but they should be interpreted within the broader market environment.
Risk Management Is More Important Than the Setup
No technical setup wins every time. Even an apparently perfect PDH breakout can fail. A professional framework therefore defines risk before taking exposure.
A disciplined trader defines:
- Maximum acceptable risk per trade
- Position size
- Invalidation condition
- Maximum daily loss
- Maximum number of trades
- Conditions under which no trade should be taken
Position Sizing
Position size should be based on predefined risk, not excitement. A setup that looks attractive is still uncertain. Oversized exposure can turn one ordinary failed breakout into a disproportionately large loss.
Stop-Loss / Invalidation Logic
The invalidation point should relate to the logic of the setup, such as a failed retest, a recent swing point or a structural breakdown. There is no single stop rule suitable for every instrument and timeframe.
Risk-to-Reward Ratio
Ratios such as 1:1.5, 1:2 or 1:3 can be useful, but they do not determine profitability by themselves. Overall performance depends on win rate, average winner, average loser, brokerage, taxes, slippage, execution and discipline.
Backtesting, Forward Testing and Trading Journals
A PDH/PDL strategy should be studied over a meaningful sample instead of judged from a handful of attractive charts.
What to Record
| Field | Example |
|---|---|
| Date | Trading session |
| Instrument | Nifty, Bank Nifty, stock or commodity |
| PDH / PDL | Exact previous-day levels |
| Opening Condition | Inside range, gap above PDH, gap below PDL |
| Break Time | When the level was crossed |
| VWAP / Structure | Above/below VWAP, HH-HL or LH-LL |
| Volume | Strong, normal or weak |
| Retest | Yes / No |
| Outcome | Continuation, failure, reversal, no follow-through |
| Lesson | What should be repeated or avoided |
After 50, 100 or 200 observations, patterns may become clearer. You may discover that certain times, sectors, gap conditions or volume profiles behave differently.
Professional PDH/PDL Observation Checklist
Common Beginner Mistakes
- Buying immediately above PDH: a brief move above the level can fail.
- Selling immediately below PDL: price can sweep the low and recover quickly.
- Ignoring volume: weak participation may reduce confidence in a breakout.
- Ignoring market direction: a stock breakout against a strongly weak market deserves additional caution.
- Trading every touch: most PDH/PDL interactions are not automatically high-quality setups.
- Chasing very large candles: the move may already be extended.
- Oversizing: no setup is guaranteed.
- Skipping backtesting: attractive chart examples are not proof of a repeatable edge.
Can PDH/PDL Be Automated in a Scanner or Dashboard?
Yes. A scanner or dashboard can automatically calculate and display:
Level Status
PDH, PDL, distance from the level, breakout, breakdown and retest state.
Confirmation Data
VWAP, EMA alignment, RSI, ADX, volume and market structure.
Context
Sector trend, market breadth, F&O Open Interest and multi-timeframe direction.
Automation can save time and organize information, but it does not eliminate market risk or the need for proper testing and human judgment.
Frequently Asked Questions
What does PDH mean in trading?
PDH stands for Previous Day High, the highest traded price of the previous trading session.
What does PDL mean in trading?
PDL stands for Previous Day Low, the lowest traded price of the previous trading session.
Is PDH always resistance?
No. PDH may act as resistance when approached from below, but after a successful breakout it may sometimes act as support.
Is PDL always support?
No. PDL may act as support when approached from above, but after a successful breakdown it may sometimes act as resistance.
Does crossing PDH automatically mean the market will rise?
No. Price can cross PDH temporarily and then reverse. Candle close, volume, structure and follow-through matter.
Does crossing PDL automatically mean the market will fall?
No. False breakdowns and liquidity sweeps can occur. Confirmation is important.
Which timeframe is best for PDH/PDL?
There is no universally best timeframe. Many intraday traders study 5-minute or 15-minute charts while using higher timeframes for broader context.
Can PDH/PDL be used for Nifty and Bank Nifty?
Yes. The concept can be applied to indices as well as liquid stocks, futures and other markets.
Can PDH/PDL be combined with VWAP?
Yes. VWAP can provide additional intraday context, but it should not be treated as a guarantee.
Does a PDH/PDL strategy guarantee profits?
No. No technical-analysis strategy can guarantee profits or prevent losses.
Final Thoughts
PDH and PDL are valuable because they are simple, transparent and based directly on price. A beginner can understand them quickly, while an experienced trader can combine them with market structure, VWAP, volume, trend, sector strength, derivatives data and multi-timeframe analysis.
The central lesson is simple: do not treat Previous Day High as an automatic Buy level or Previous Day Low as an automatic Sell level. Study how price approaches, breaks, retests, rejects and reclaims these areas.
A disciplined trader observes evidence, defines risk, keeps records and improves the framework through testing rather than prediction.
Leave a Reply